

Why Workflow Visibility Matters in Cytogenetics and Pathology Laboratories
Dashboards are easy to build and easy to misuse. What laboratory teams genuinely gain from visibility into case status, review queues and system activity, and where to be careful.
Most laboratories already hold the information needed to understand their own workload. It is simply distributed: partly in the laboratory information system, partly in the imaging platform, partly in the working knowledge of the people running the bench. Workflow visibility is the practice of bringing enough of it together that the team can see the current state of work without reconstructing it by hand.
What visibility covers
In cytogenetics and pathology, a small number of views tend to carry most of the practical value.
- Case status: what has been scanned, what is awaiting analysis, what is in review, and what is complete.
- Review queues: how work is distributed between analysts and reviewers, and where cases are accumulating.
- Reporting: which confirmed results are still to be issued.
- Platform activity: scanner and workstation utilisation, and whether capacity is being used as intended.
- Quality indicators the laboratory has chosen to track, defined and interpreted locally.
Collecting metrics is not the same as using them
It is straightforward to display counts. Turning them into good decisions is harder, and the failure modes are well known: metrics divorced from case mix, comparisons between roles doing different work, or numbers treated as conclusions rather than prompts to ask a question.
A useful discipline is to decide, before a metric is displayed, what action it would inform. A queue length that no one can act on is decoration; a queue length that triggers reassignment is a working control.
Role-appropriate views
Different people need different slices of the same underlying data. An analyst mainly needs their own assigned work and what is blocking it. A reviewer needs what is waiting for sign-out. A laboratory manager needs where work is accumulating across the whole pipeline and whether capacity matches demand.
Presenting each role with the view it needs, rather than one universal screen, tends to make bottlenecks more visible and dashboards more likely to be used at all.
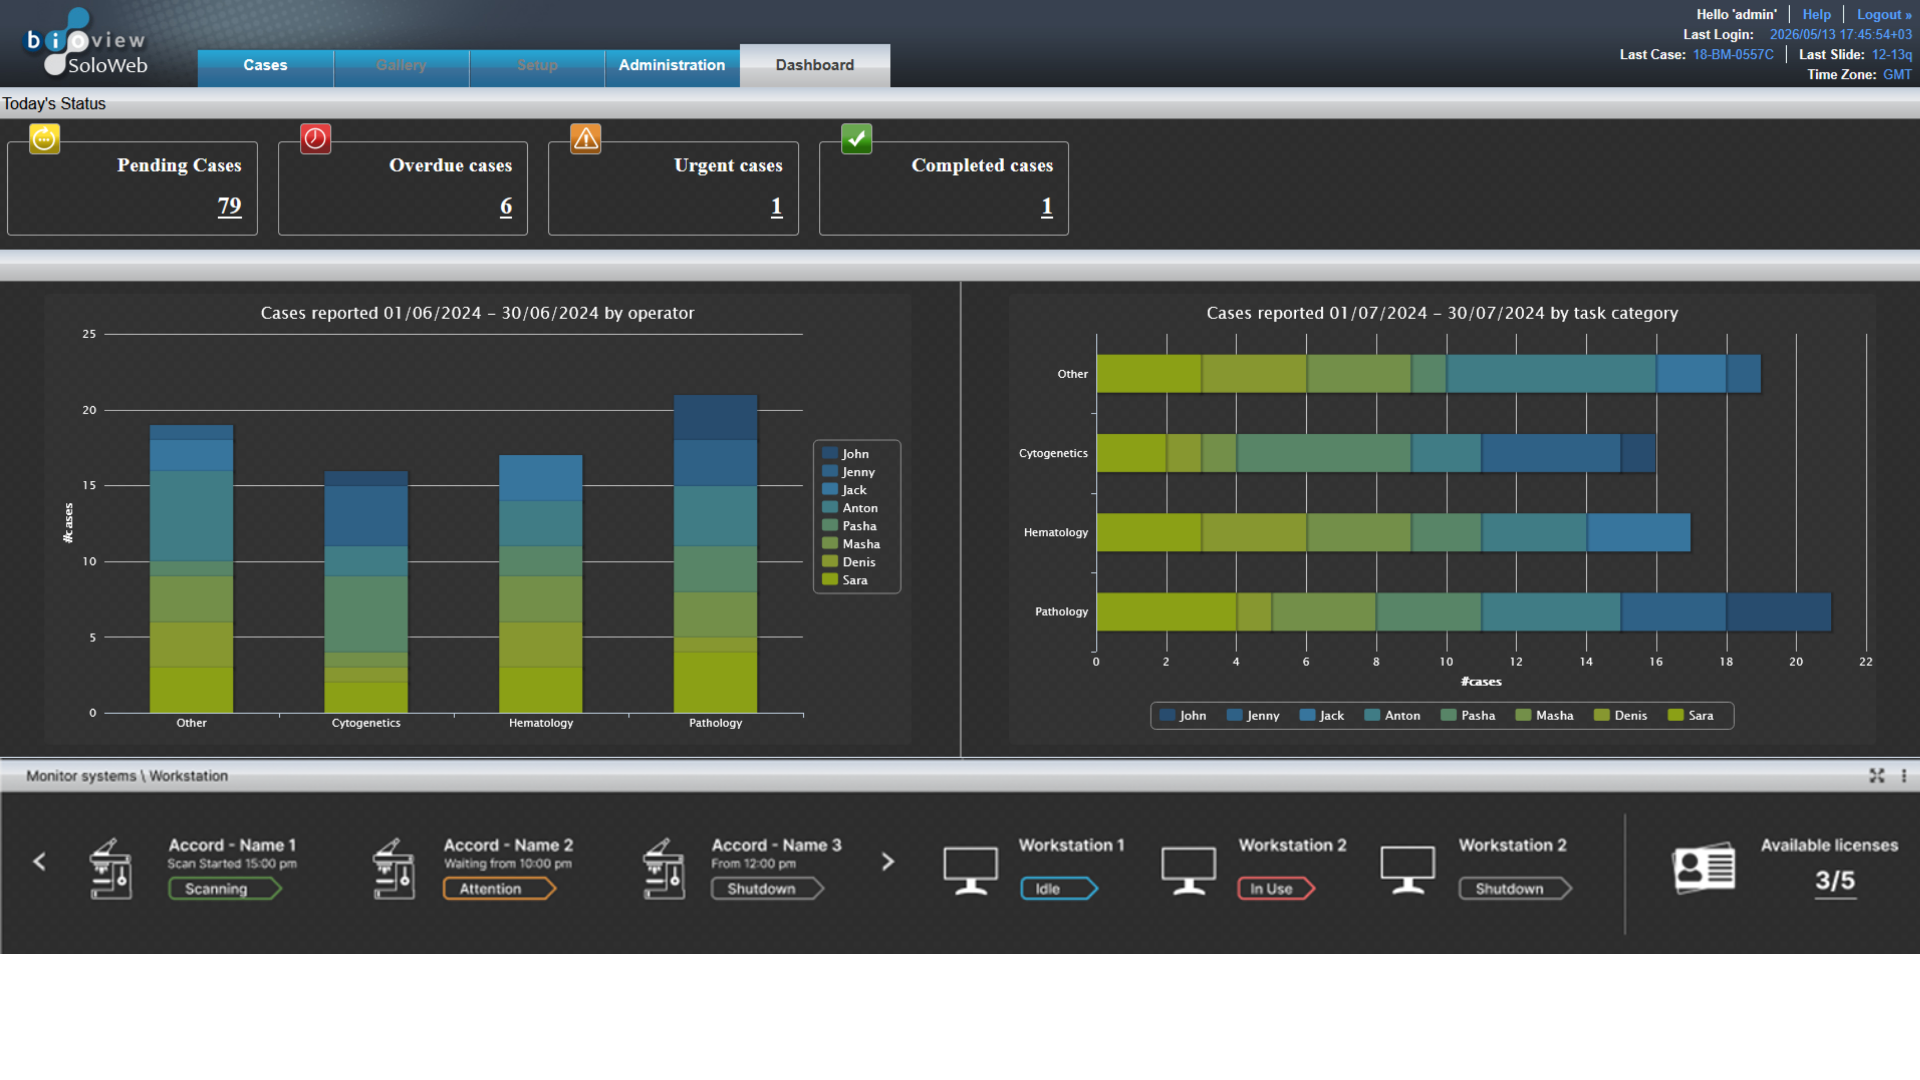
Useful questions a dashboard should answer
- What is currently waiting, and at which stage of the workflow?
- Which cases have been in one state longer than expected?
- Is work distributed reasonably across the available team today?
- Are the imaging platforms being used at the level the laboratory planned for?
- Where did the last week's delays actually occur?
- Is there anything requiring attention that no one has been assigned to?
Cautions worth building in
- Context: complexity, case mix and staffing differ between periods and between sites; raw counts rarely compare cleanly.
- Definitions: agree what each metric counts and when the clock starts and stops, and document it.
- Access control: operational data can be sensitive, and visibility should follow role and applicable data protection requirements.
- Avoiding simplistic performance judgements: throughput figures describe a process, not the quality of an individual's professional work.
Used with those caveats, visibility is a coordination tool. It does not make analytical decisions and should not be asked to; it helps a team see the state of its own work clearly enough to organise it well.